
Trace Genomics is another data layer to add to Wilbur Ellis’ impressive offering of analytics. There have been ways to quantify the soil chemistry and tissue data to assess plant nutrient status for many years. The gap has always been the lack of data for the unseen portion of the plant, the root system and soil rhizosphere.
Half the plant is hidden in an underground world that we know very little about, it plays an essential role in hundreds of ways, just a few being nutrient cycling, carbon breakdown and plant root health. Every person who nurtures a crop knows that the soil microbiology is important, but up until this point we have not had a concrete way to quantify why a soil was more productive than another based on the living component. Trace Genomics has done something truly unique; they have sequenced a huge portion of the soil DNA. When a soil sample is sent to them the report that comes back tells you what species of beneficial microbes or pathogens are in the soil. Up until this point a “healthy” soil test was just one that gassed off the most CO2, now we are drilling down to which microbes are in the soil and what they do.
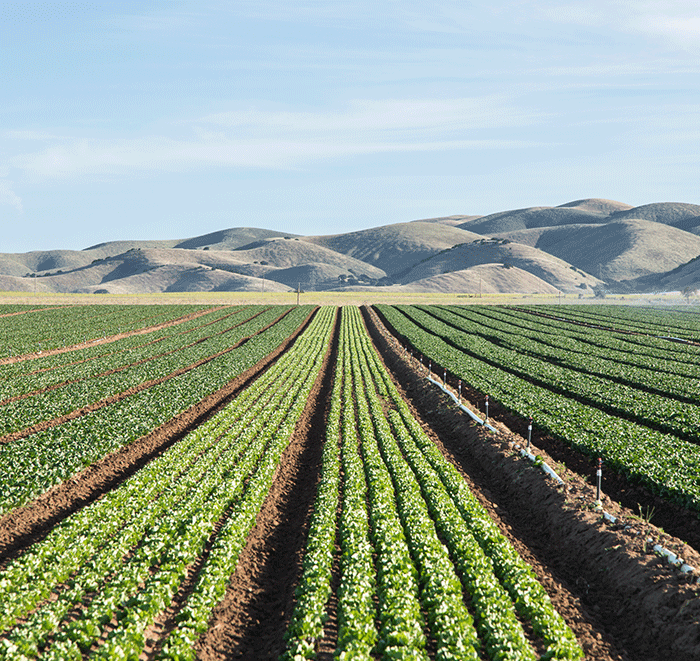
Trace is a revolutionary process, but one tool cannot solve the complex problems we see in the field every day. That is why Wilbur Ellis has assembled a package of analytic tools to give our agronomists the data they need to get the most cutting-edge agronomic solutions available today. An issue in the field could play out like this; a problem area in the field is spotted by one of our agronomists. Aerial imagery them comes into play to see the extent and severity of that problem area.
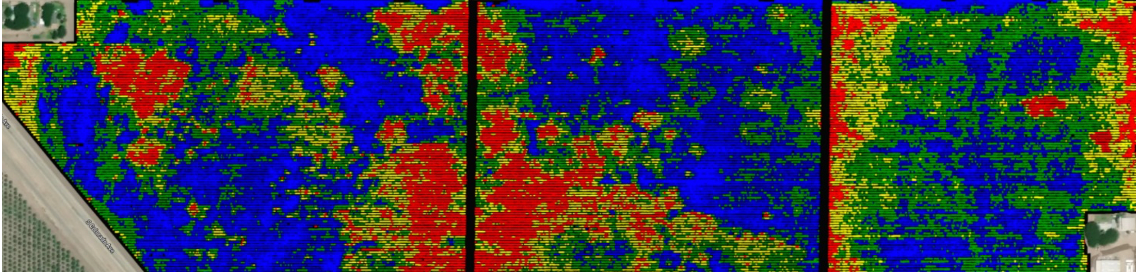
In this image, we can see the stressed areas in the field, by looking at different types of images available we can decide which direction to take. Is it a watering issue or a soil issue?
If it is determined that it is not irrigation uniformity the next step is to reference grid samples to look at the soil chemistry.
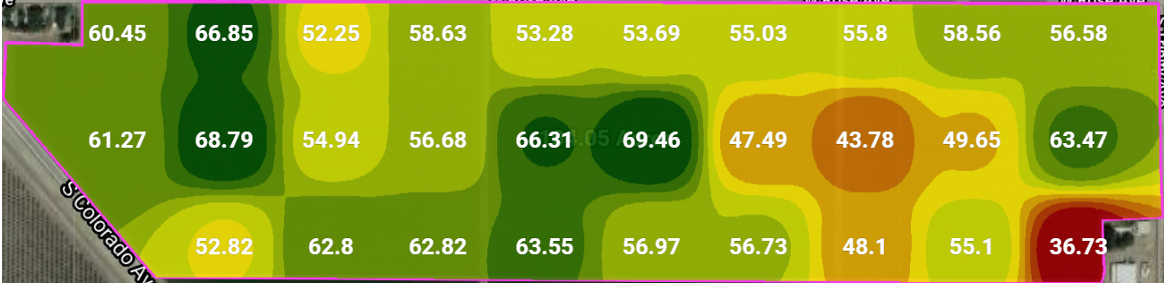
Presented above is a grid map of soil Saturation Percentage, or SP, which is an indirect estimate of soil texture. The greater the SP, the heavier the soil texture.
There is considerable variability within this field, the areas with the weakest canopy have the heaviest soil texture. Saturated soil conditions in those areas may lead to a higher incidence of root diseases. Trace Genomics would be the next step to figure that out.
WilburEllis’ partnership with Trace Genomics can help uncover something truly special, to pull the curtain back on the complexity of the rhizosphere. The cause of yield loss that went unsolved in the past is now able to be brought to light due to this technology layer added into our already robust offering of agronomic tools. If you are interested in learning about the biology of the soil beneath your feet contact your Wilbur Ellis Agronomist.
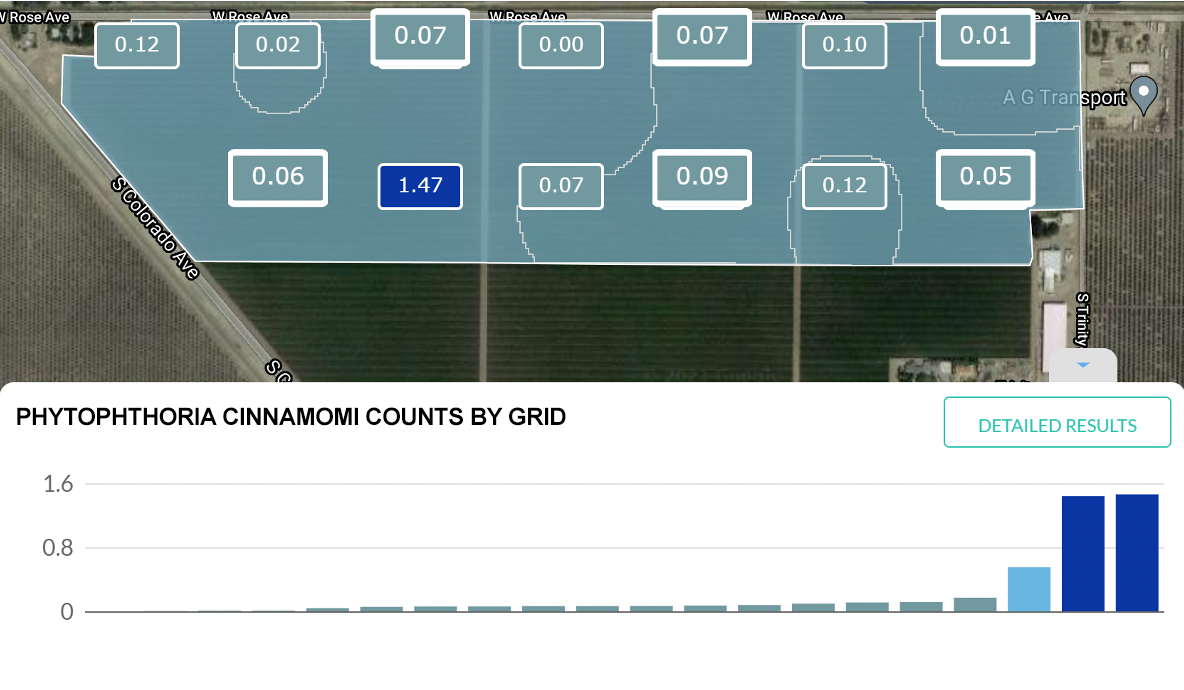
The trace data layer shows a higher incidence of root diseases in the affected area. Now the agronomists can get to work creating a tailored solution for that specific field.
Justin Burrows, Wilbur-Ellis Sales Representative