")
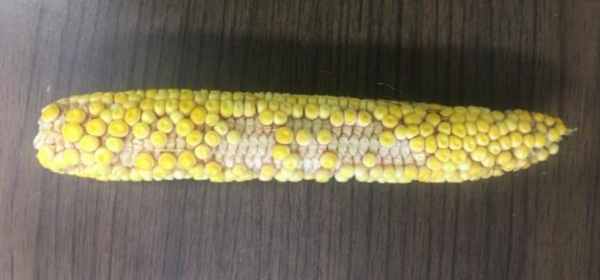
Don’t be alarmed with the sample pictured below – I did hunt a bit for this; however, there is an erratic kernel set and underdeveloped ears this year now that pollination is ending. But wait, there is more to this.
Is the cup ½ full or ½ empty? This time of year, corn ears are being stripped back at alarming rates, and it is good to see the fruits of our labor, right? Let’s hope so, but this year, if you are like me, you may be hearing and starting to see less-than-perfect kernel development in several circumstances. Most of these are assumed to be related to the May-June dry weather in some locations across the state. Don’t be alarmed, this happens to some degree each year, but be aware that tons of circumstances can lead to these developments, and reviewing the season to date is a valuable reference. Yes, I have referenced dry weather several times, which is largely the main culprit this year. Regardless, we will encounter some fields that may have had problems with flowering and grain fill. I have always enjoyed this article from Bob Nielson at Purdue University as it spells out similar challenges, we have had this season. Use this or discard it, but remember it is as essential to see what is there than to see what isn’t. In addition, the abnormal ear poster from Ohio State University is also great to help identify possible ear malformation issues.
Late Stages of Corn Development
Use the table below to determine your corn stage, length to maturity, and the effects that stress during these stages can have on final grain yield.
| Growth Stage | Days To Maturity | Description |
|---|---|---|
| Blister (R2) | 40-50 | Kernels are white and resemble blisters. Relocation of plant nutrients from vegetative structures to the ear has begun. Severe stress can easily cause tip kernels to abort. |
| Milk (R3) | 35-42 | Kernels are mostly yellow and contain a milky-white fluid. This is the “roasting ear” stage. Severe stress can still abort kernels as well as reduce kernel weight. |
| Dough (R4) | 30-36 | Continued starch accumulation is giving the kernel’s inner fluid a pasty consistency. Kernel abortion is not very likely, but severe stress can reduce test weight. |
| Dent (R5) | 20-27 | All or nearly all of the kernels are dented. The milk line slowly progresses to the kernel tip over the next 3 weeks or so. Kernel moisture at the beginning of the R5 stage is approximately 55%. When the kernel reaches ½ milk line, it will be roughly 40% moisture, 10 to 14 days from black layer, and have attained 95% of its maximum yield. Stress at this stage can still reduce kernel weight but not number. |
| Maturity (R6) | 0 | The black layer has formed and kernels have attained their maximum dry weight. Kernel moisture is roughly 30 to 35%. Stress at this point will not hurt final yield. |
At our current pace, much of the corn in SE Nebraska should black layer (physiological maturity) sometime in the 20s of August. The corn kernel reaches physiological maturity and maximum dry weight with the appearance of the black layer near the tip of the kernel. This generally coincides with kernel moisture of 30 to 35%. You can see the black layer by removing the kernel tip with your thumbnail or by cutting the kernel in half lengthwise. The black layer is caused by collapsing cells that block the tubes translocating food into the kernel. Tip kernels will reach black layer first. Under stress, tip kernels will reach black layer relatively early, indicating the plant was not able to completely fill all the kernels that were pollinated.
This year, in dryer areas, we are bound to have misrepresented soil fertility levels when soil sampling this fall. If you have sampling/conducting stalk/tissue tests now or are waiting to soil sample this fall, I might compare the results to the amount of fertility applied and consider the amount of fertility needed to produce the bushels you harvest. During a dry season, some of your applied fertility has not/will not be harvested by the developing crop. Without adequate soil water to make the elemental fertility available for crop roots to absorb them, the elements, to some degree, would lie unused. You very well may see discoloring of the leaves—that is normal for this time of year. But, this year may not mean that the crop is deficient in nutrition.
CROP NUTRITION
All crops need a certain amount of many elements. There are 16 of them: nitrogen (N), phosphorus (P), potassium (K) sulfur (S), magnesium (Mg), calcium (Ca), Oxygen (O), carbon (C), hydrogen (H), molybdenum (Mo), copper (Cu), Zinc (Zn) manganese (Mn0, boron (B), iron (Fe) and chlorine (Ci). We mainly only consider the N-P-K mix in most fertility programs for many reasons. The main reason is the amount of these elements that are used within the plants is much higher than the other thirteen, and are classified by either being a primary, secondary, or micronutrient.
- nitrogen (N) – Primary
- phosphorus (P) – Primary
- potassium (K) – Primary
- sulfur (S) – Secondary
- magnesium (Mg) – Secondary
- calcium (Ca) – Secondary
- oxygen (O) – Air/Water/Primary
- carbon (C) – Air/Primary
- hydrogen (H) – Air/Water/Primary
- molybdenum (Mo) – Micronutrient
- copper (Cu) – Micronutrient
- zinc (Zn) – Micronutrient
- manganese (Mn) – Micronutrient
- boron (B) – Micronutrient
- iron (Fe) – Micronutrient
- chlorine (Cl) – Micronutrient
Recognizing the role N-P-K play in plant metabolism is an essential part of unlocking the mysteries of nutrient deficiencies:
Nitrogen – a key component of protein and chlorophyll
Phosphorus – a key component in proteins
Potassium – plays a major role in catalytic processes in plants such as enzymes and metabolism
Nitrogen is required the most as it has elemental roles in cell formation, chlorophyll production, protein, and enzyme synthesis that drives metabolism. Phosphorus aids in the formation of DNA, RNA, and forms of energy used in nutrient transfer, cell division, early growth, root formation, seed production, and all aspects of plant growth. Potassium plays a regulatory role in photosynthesis, carbohydrate movement, and protein synthesis. It aids in the development of normal plant height, healthy stems and roots, and disease resistance.
Soybean Grain/Stover Nutrient Removal Chart
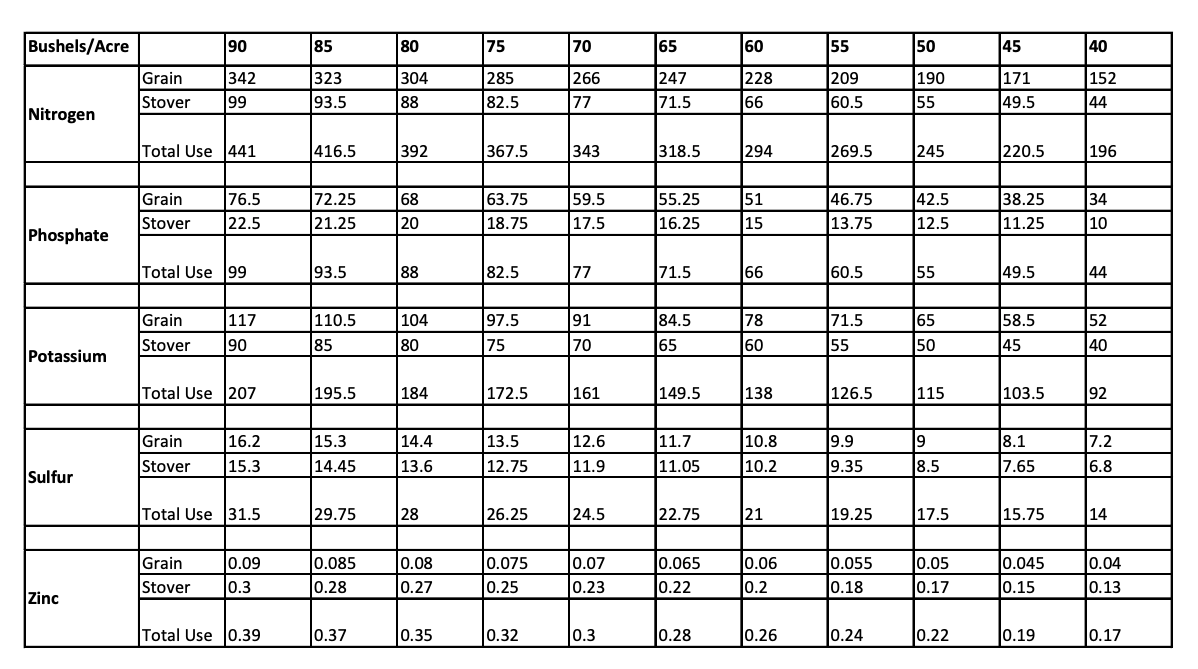
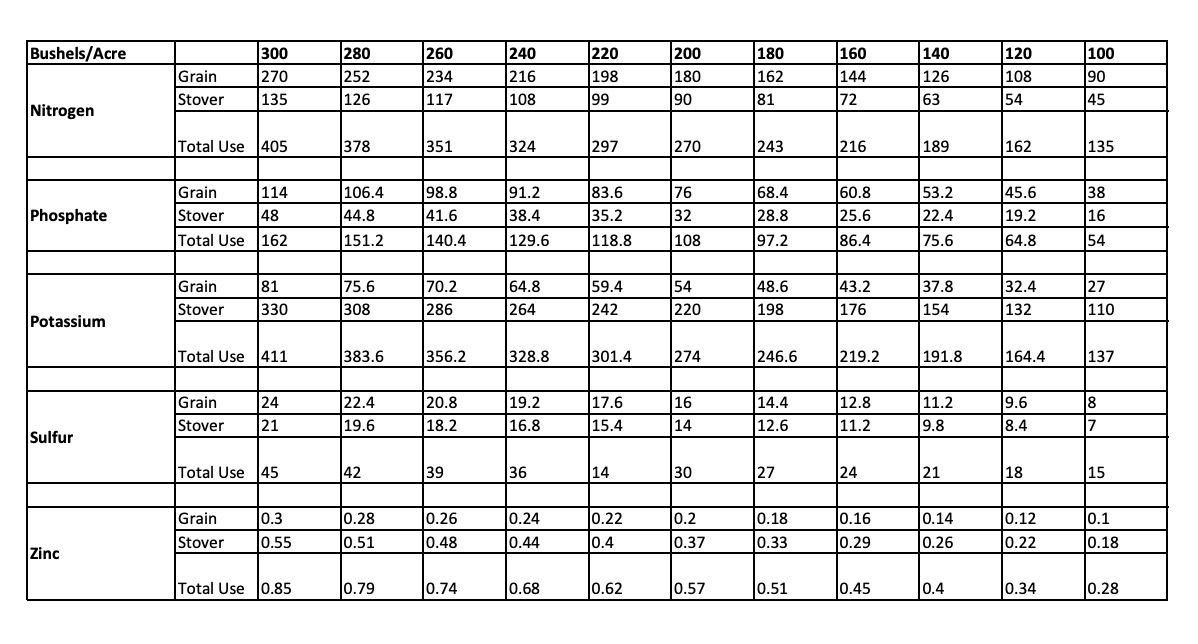
Corn Grain/Stover Nutrient Removal Chart
Dr. John McNamara // Wilbur-Ellis Agronomist